Visualizing Maxwell's Equations
Introduction
There are a few times in physics when the equations describing physical phenomena are surprisingly simple and beautiful as a result. Maxwell’s equations are an excellent example of this; with just four equations, all of classical electromagnetism can be described.
In differential form1, they are as follows:
\begin{equation} \label{eq:1} \nabla \cdot E = \frac{\rho}{\varepsilon_0} \end{equation}
\begin{equation} \label{eq:2} \nabla \cdot B = 0 \end{equation}
\begin{equation} \label{eq:3} \nabla \times E = -\frac{\partial B}{\partial t} \end{equation}
\begin{equation} \label{eq:4} \nabla \times B = \mu_0 (J + \varepsilon_0 \frac{\partial E}{\partial t}) \end{equation}
While mathematically describing physical behavior is efficient, it can be hard to properly visualize it. What are the above equations describing exactly? Let us go through them one by one.
Gauss’s Law
Gauss’s Law is what we call equation \ref{eq:1}, where it is quite simply stating that the amount of electric field going through a surface (also known as flux) is equivalent to the total amount of electric charge on the surface divided by the permittivity of free space (how much it can permeate in a vacuum).
How does the equation show this? Well, the ∇ in the equation is the del operator which is definied as follows:
\begin{equation} \label{eq:5} \nabla = \hat{x}\frac{\partial }{\partial x} + \hat{y}\frac{\partial }{\partial y} + \hat{z}\frac{\partial }{\partial z} \end{equation}
It is finding the rate of change of whatever it is multiplied by in every direction. If you multiplied it by a scalar value, it would provide you with a gradient. However, if you multiply it with a vector by using a dot product, it provides you with something very interesting:
\begin{equation*} \nabla \cdot v = (\hat{x}\frac{\partial }{\partial x} + \hat{y}\frac{\partial }{\partial y} + \hat{z}\frac{\partial }{\partial z}) \cdot (v_x \hat{x} + v_y \hat{y} + v_z \hat{z}) \end{equation*}
\begin{equation} \label{eq:6} = \hat{x}\frac{\partial v_x}{\partial x} + \hat{y}\frac{\partial v_y}{\partial y} + \hat{z}\frac{\partial v_z}{\partial z} \end{equation}
This is called the divergence of a vector. What it describes is how much the vector is diverging or spreading out from a point. For example, if you described the electric field emanating from a positive charge as a vector field and measured the divergence of the vectors from the charge, you would get a large positive divergence. A useful approach is to associate divergence with density. If the vectors are moving apart or coming closer together (i.e. their density is changing), they have positive and negative divergence respectfully. Vectors that are equally densely separated have no divergence.
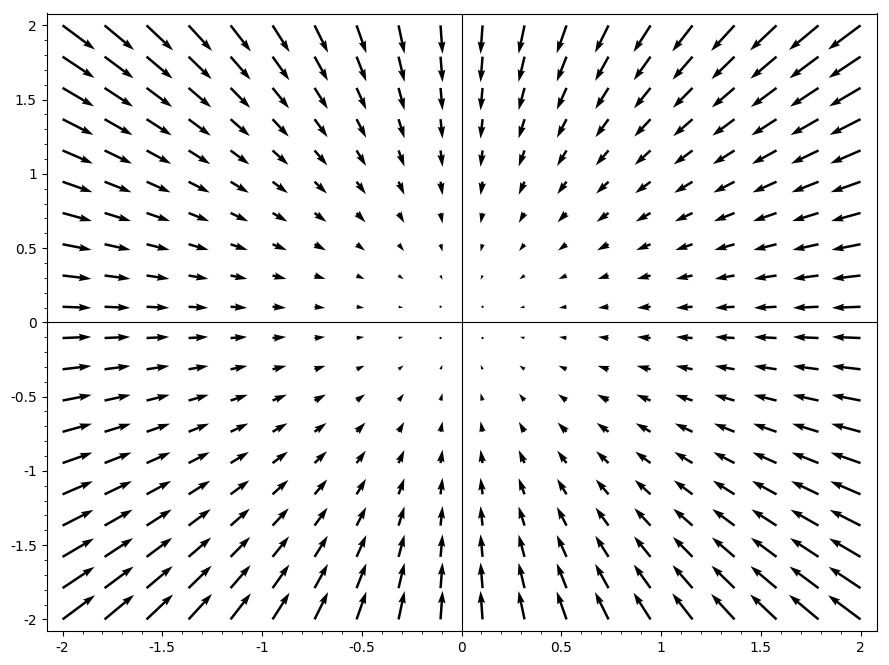
If we wanted to visualize the vector field of a point charge, we could do so with the following snippet of code utilizing the sagemath library:
var("y")
plot_vector_field((-x,-y), (x,-2,2), (y,-2,2), figsize=9)
The figure it produces is as follows:

Figure 1: Negative divergence of an electric vector field belonging to a point charge at the origin.
The remaining variables in equation \ref{eq:1} are quite straight forward. The E is a vector field representing the electric field produced by a point charge (or many). The ρ represents the density of the electric charges on or in the surface in question and the ε0 is the permittivity of free space.
Gauss’s Law for Magnetism
Now, Gauss’s law for magnetism in equation \ref{eq:2} is by far the simplest of Maxwell’s equations. Its explanation is also surprisingly simple: there are no magnetic monopoles (as there are with electric charges), instead there are only magnetic dipoles. The positive side of the dipole will produce a vector field with positive divergence that will eventually loop back to the negative side of the dipole with an equally negative divergence. The result is that the total divergence of a magnetic vector field is 0, since the positive and negative divergence cancel out.
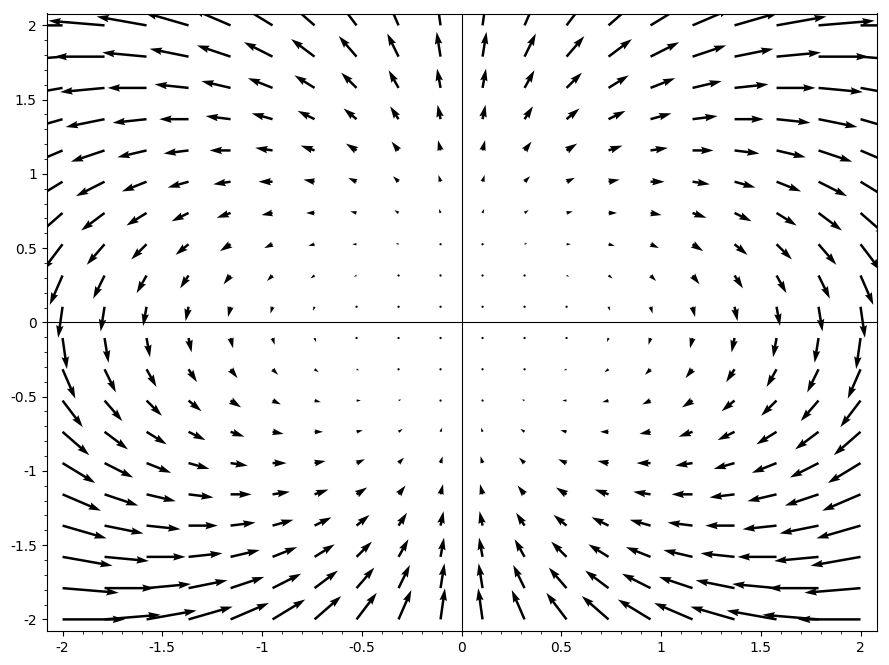
Once again, we can utilize the sagemath library and execute the following:
var("y")
plot_vector_field((2*x*y,y*y - x*x), (x,-2,2), (y,-2,2), figsize=9)
The resulting figure is as follows:

Figure 2: An example of a magnetic dipole displayed as a vector field.
In figure 2, we can see quite clearly that any outgoing field lines eventually become incoming field lines. Thus, the net magnetic flux is always zero.
Faraday’s Law of Induction
Equation \ref{eq:3} is a very interesting one. You will notice that we are multiplying the del operator and the electric field by using a cross product. Using a cross product with the del operator yields us very different results than when we use the dot product:
\begin{equation} \label{eq:7} \nabla \times v = \hat{x}(\frac{\partial v_z}{\partial y} - \frac{\partial v_y}{\partial z}) + \hat{y}(\frac{\partial v_x}{\partial z} - \frac{\partial v_z}{\partial x}) + \hat{z}(\frac{\partial v_y}{\partial x} - \frac{\partial v_x}{\partial y}) \end{equation}
This is called the curl of a vector. Like the divergence, the curl is an excellent name because it shows us how much the vector is curling or rotating. So Faraday’s law of induction is telling us that the curl of the electric field is equal to the negative rate of change of the magnetic field with time.
Here we must keep in mind one of the golden rules in physics: nature always opposes any induced change2. If you passed a magnet through a coil of wire (thus creating a magnetic field that changes with time), it would induce a current in the coil which would then in turn create a magnetic field opposing the changing magnetic field you produced.
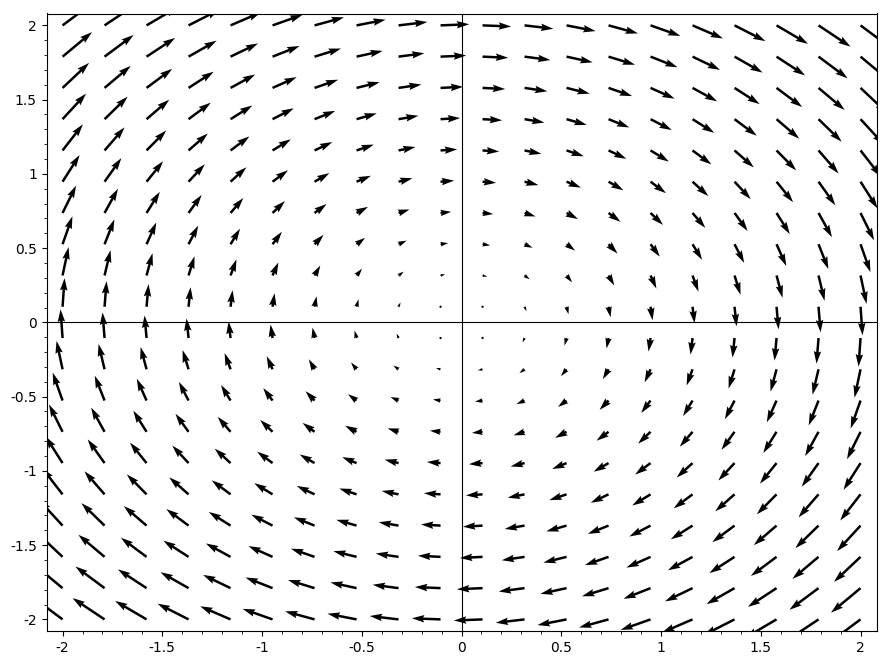
Let us see what the curl of the electric field would look like. Using sagemath, we can try the following:
var("y")
plot_vector_field((y,-x), (x,-2,2), (y,-2,2), figsize=9)
Which results in the following figure:

Figure 3: An example of an electric vector field with a large positive curl.
By using the right hand rule on figure 3, we can see that the magnetic field lines will go into the screen. If you had a magnetic field coming out of the screen, the electric field would be produced as in figure 3 and the resulting magnetic field would oppose the one coming out of the screen.
Ampère’s Law
At first glance, equation \ref{eq:4} seems complicated; it certainly is the longest of Maxwell’s equations. However, once we break it down, its simplicity will become more evident. There are two new terms in this equation, μ_0 (the permeability of free space) and J (the total electric current density). In essence, all Ampère’s law is stating is that a magnetic field can be produced by an electric current or a changing electric field.
The visualization of the magnetic field produced will be very similar to figure 2. If you have current running through a wire, we can use the right hand rule to see how the magnetic field would get produced around it.
-
If you thought I was going to write out all those integrals in Latex, you thought wrong. ↩︎
-
This is coincidentally roughly the same excuse I get from my boss when I ask for a raise. If m is my salary earned, t is time, i is inflation and w is my will to live, we can construct the following equation: \begin{equation*} w = \frac{\partial m}{\partial t} - \frac{\partial i}{\partial t} \end{equation*} Please send help. ↩︎